Question 4 - Hubble's Law

In order to demonstrate the path of a light ray with space expansion following Hubble's Law three functions are used: a(t), b(t) and r(t)

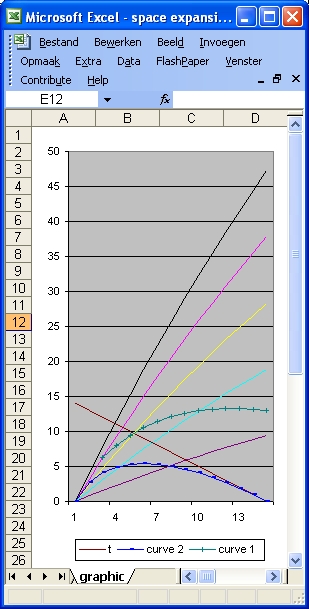
In this particulair simulation a1 = 160 and a2 = 200. That means that the final value of 160 is reached after 200 billion years. This implies that in the range of 0 to 14 billion years the function increases linear.
b1 = 0 that means no acceleration is involved.

Figure 1
Figure 2
t
14
13
12
11
10
9
8
7
6
5
4
3
2
1
0
v
4,00
2,74
2,00
1,56
1,25
1,01
0,82
0,66
0,52
0,41
0,30
0,21
0,13
0,06
0,00
z
25,81
21,05
17,76
15,06
12,74
10,72
8,94
7,35
5,94
4,66
3,52
2,50
1,57
0,74
0,00
v1
0,090
0,083
0,077
0,070
0,063
0,056
0,050
0,043
0,037
0,031
0,024
0,018
0,012
0,006
0,000
z1
1,066
0,984
0,904
0,824
0,745
0,667
0,589
0,513
0,437
0,363
0,288
0,215
0,143
0,071
0,000
The table on the left consists of five columns.
  • Column 1 shows the time since the Big Bang in increments of 1 billion lightyears.
  • Column "v" shows the speed in increments of 1 billion lightyears starting from the Big Bang
  • Column "z" shows space expansion in increments of 1 billion lightyears starting from the Big Bang
  • Column "v1" shows the speed in increments of 100 million lightyears starting 1400 million years ago from present.
  • Column "z1" shows space expansion in increments of 100 million lightyears starting 1400 million years ago from present.
The z1 column shows a clearly linear relation for the first 1 billion years between z and distance as described by Hubble's Law.
The v1 column and the z1 also shows a linear relation for the first 1 billion years as described by the relation: v = c * z.
The z column shows clearly that also for the function used in this example Hubble's Law is not valid for the first 5 billion years after the Big Bang.

The black line in Figure 1 shows the 100% line of space expansion.
The magenta, yellow, cyan and purple lines show the 80%, 60%, 40% and 20% lines assuming that the Cosmological principle applies
The blue line in Figure 1 shows the path of the light ray towards the Observer at present.

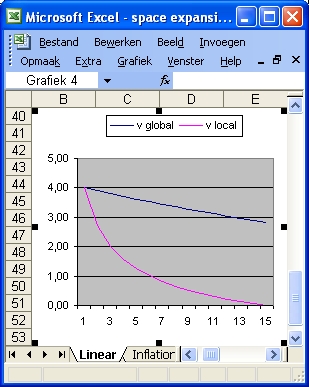
The blue line Figure 2 shows the speed involved near the 100% line (the black line in Figure 1) is much larger than c.
The magenta line in Figure 2 shows the expansion speed of the blue line in Figure 1.

Back to Friedmann's Equation Question 4